Home /
Expert Answers /
Economics /
the-table-below-depicts-the-12-mont-percentage-change-of-the-cpi-in-the-energy-category-explain-th-pa405
(Solved): The table below depicts the 12-mont percentage change of the CPI. in the energy category. Explain th ...
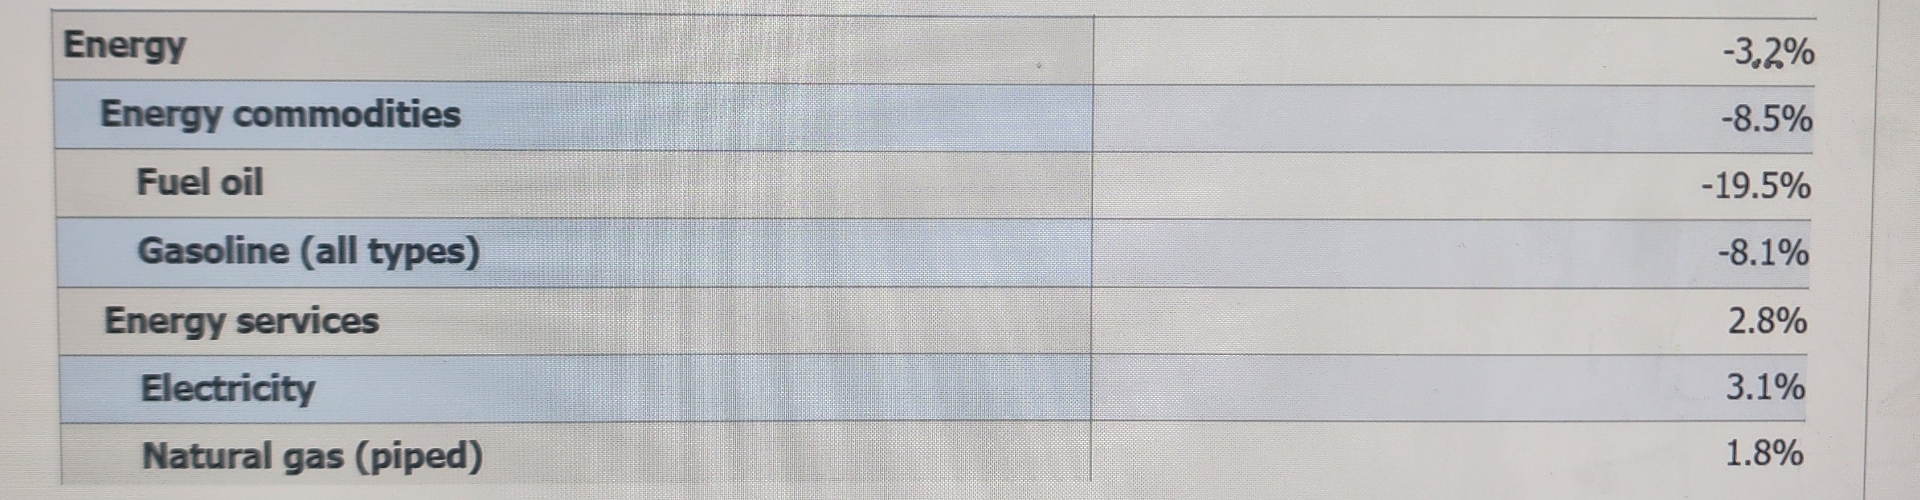
The table below depicts the 12-mont percentage change of the CPI. in the energy category. Explain the contrasting and divergent behavior of the CPI of energy commodities with
-8.5%and the electricity service is
3.1%.